A Smart Way to Compare This Year’s Sales with Last Year’s (Up to This Point)
Bruno, one of our lovely Light Blue customers, got in touch with a really good question:
“How can I compare my sales so far this year to the same point last year?”
It’s a great one and it’s exactly the kind of insight that helps you understand how your business is really doing.
Why it matters
At first glance, comparing this year’s sales to last year’s total might seem like a simple benchmark, but it can be misleading. After all, if it’s April and you’re looking at all of last year’s sales, that’s not a fair comparison. What you really want is a like-for-like view: this year so far vs the same period last year. That gives you a much clearer picture of how things are tracking.
Visual insights at a glance
Light Blue’s charting tools are a great way to get a clear, visual overview of how your business is performing. Whether you want to track sales, bookings, or enquiries, you can use charts to spot trends, compare year-on-year performance, and keep an eye on your totals.
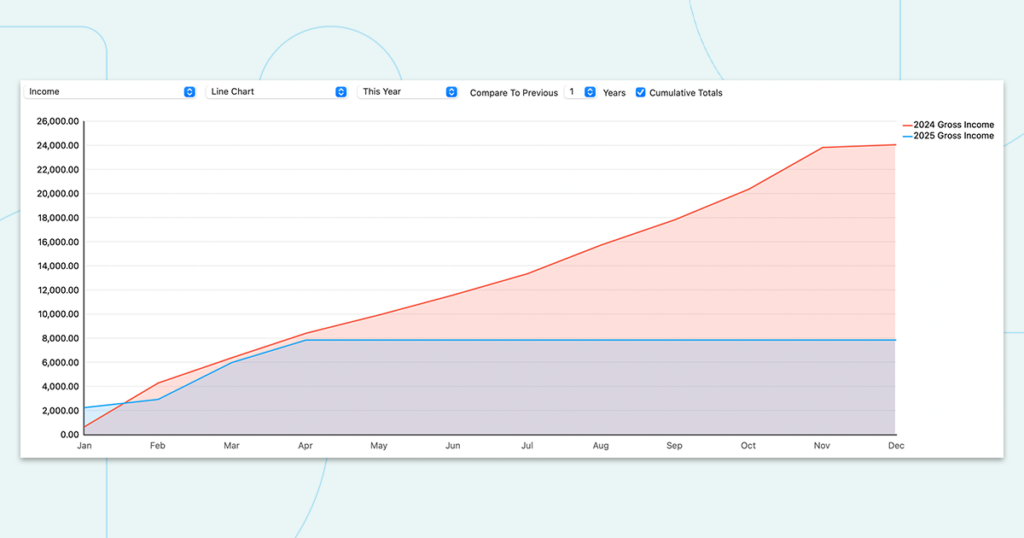
Charts can be displayed as line or bar graphs, and you can easily switch between viewing data for the current year and comparing it to previous years. They’re a brilliant way to see the bigger picture, and you can even display them on your home screen to keep key metrics front and centre.
But while charts are great for spotting patterns, Bruno also wanted something even simpler: a quick comparison of this year’s sales versus the same point last year, displayed as a single figure right on his home screen. That’s where Light Blue’s powerful query features come in.
The simple solution with Light Blue
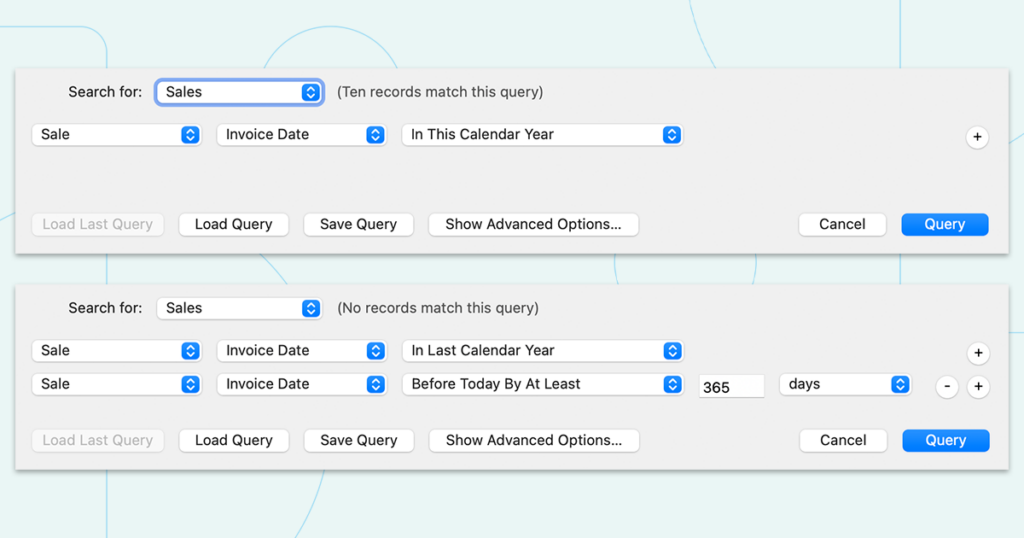
We showed Bruno how to create two simple queries in Light Blue to get the insight he needed, fast.
- One query shows sales for the current calendar year.
- The second shows sales from last year, up to today’s date (by filtering for records dated in last year and also before today by at least 365 days).
Queries in Light Blue
Light Blue’s powerful querying tools let you create completely custom reports and comparisons, based on any combination of filters like dates, record types, and financial totals. You get exactly the data you need, when you need it, to make better business decisions.
You can even take it further by adding those queries to your Home screen using a Query Totals widget. This gives you instant visibility of:
- 📈 Sales this year vs sales last year (to this date)
- 📊 Average sale value comparisons
- 📥 Enquiries and confirmed bookings
- Or any other record type—like shoot dates, invoice dates, or enquiry dates
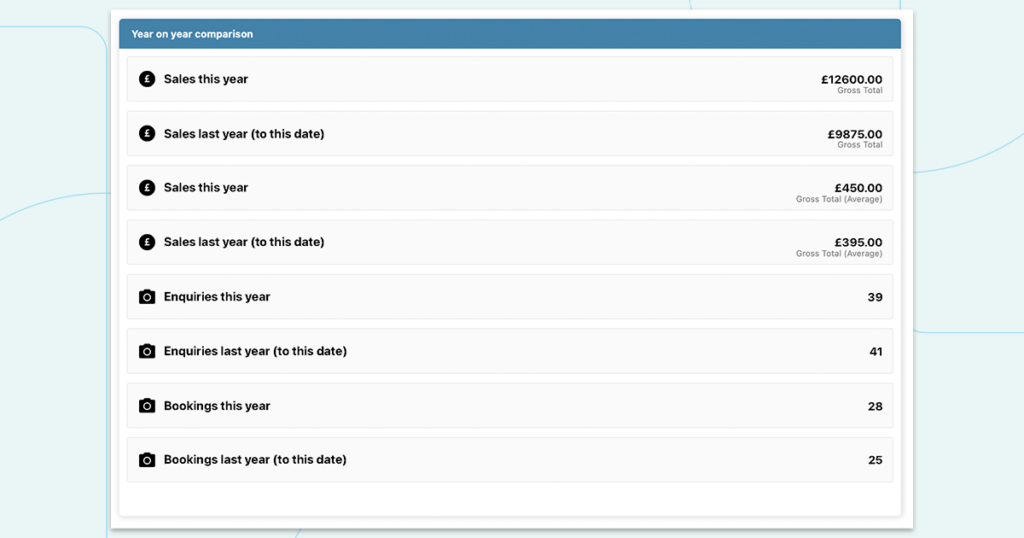
Each total can be colour-coded to help key stats stand out at a glance, and you can choose between a bold view with colours or a compact view to show more totals on screen.
This was such a smart use of Light Blue’s reporting tools that we wanted to share it with you. Thanks to Bruno for the question! 🙌
Related
- Print a Handy Summary of Your Shoot Record with Just One Click
- Present Contracts In-Person with Your iPad or Tablet
- Using Custom Fields to Forecast Portrait Session Sales
- Keep All Client Messages in One Place with a Custom Dashboard
- Two-way text messaging in Light Blue
- Never Miss a Booking with Automated Contract Reminders
- Five Positive Steps to Keep Your Business Healthy
- 7 ways photographers can use SMS messaging with Light Blue
- How to run a successful Christmas mini-session campaign
- Increase your average sales by nurturing your clients